Global Human Development
Index Spectrum
Visualization by: Gbolahan Adebayo
Date: March 2023
Type: Creative visualization
Link to Visualization: Click Here
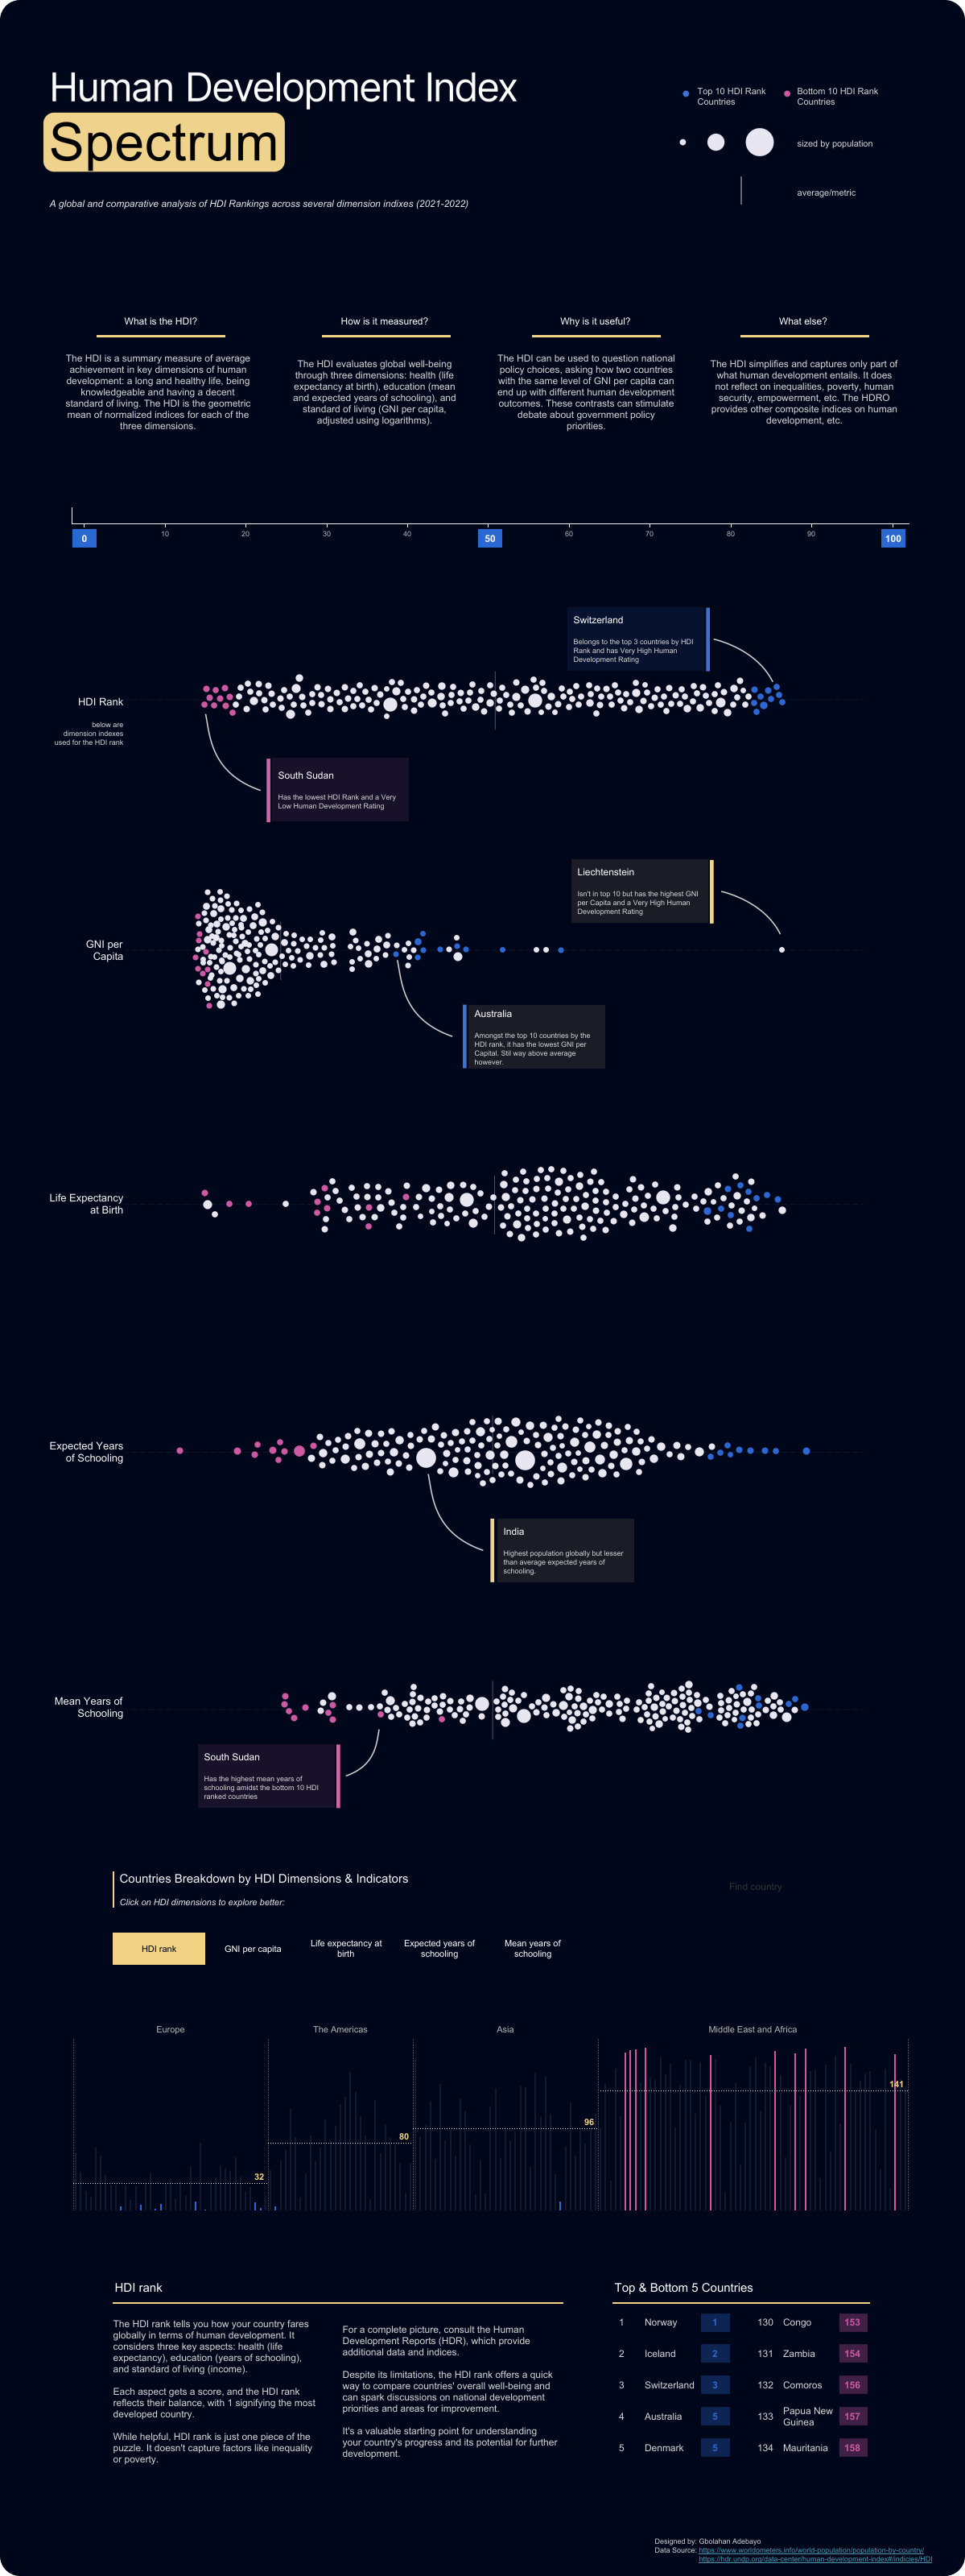
The “Global Human Development Index Spectrum” dashboard provides an insightful and visually compelling analysis of the Human Development Index (HDI) rankings across countries, focusing on various dimensions such as GNI per capita, life expectancy at birth, expected years of schooling, and mean years of schooling for the period 2021–2022. The page begins with a succinct explanation of HDI, its measurement methodology, utility, and limitations. HDI evaluates global well-being based on three core dimensions: health, education, and income, adjusted using logarithms for balanced comparisons.
The visualizations highlight the distribution of countries across a spectrum, with countries grouped by their HDI ranks. Each country is represented as a dot, with the size of the dot proportional to its population and the color indicating its HDI rank (top 10, bottom 10, or others). Key examples, such as Switzerland (highest HDI) and South Sudan (lowest HDI), are annotated for context. The dashboard also explores disparities across individual dimensions. For instance, Liechtenstein is noted for its high GNI per capita, while Australia stands out in life expectancy, and India is highlighted for its large population yet lower average years of schooling.
A breakdown of countries by region—Europe, The Americas, Asia, and the Middle East and Africa—offers deeper insights into HDI dimension trends, with a bar chart displaying variations across regions. A final table lists the top 5 and bottom 5 countries based on HDI, with Norway, Switzerland, and Australia leading, while Congo, Chad, and South Sudan lag behind. This dashboard serves as a powerful tool for understanding global inequalities and development patterns. It allows users to explore country-level data interactively and draw meaningful insights about the state of human development globally.